Figure 4.3, “Engine administration” shows the screen that is used to monitor and control an engine. The information on this screen can also be displayed using this command:
epadmin --servicename=A.X display --engine name=sandbox_Timer0
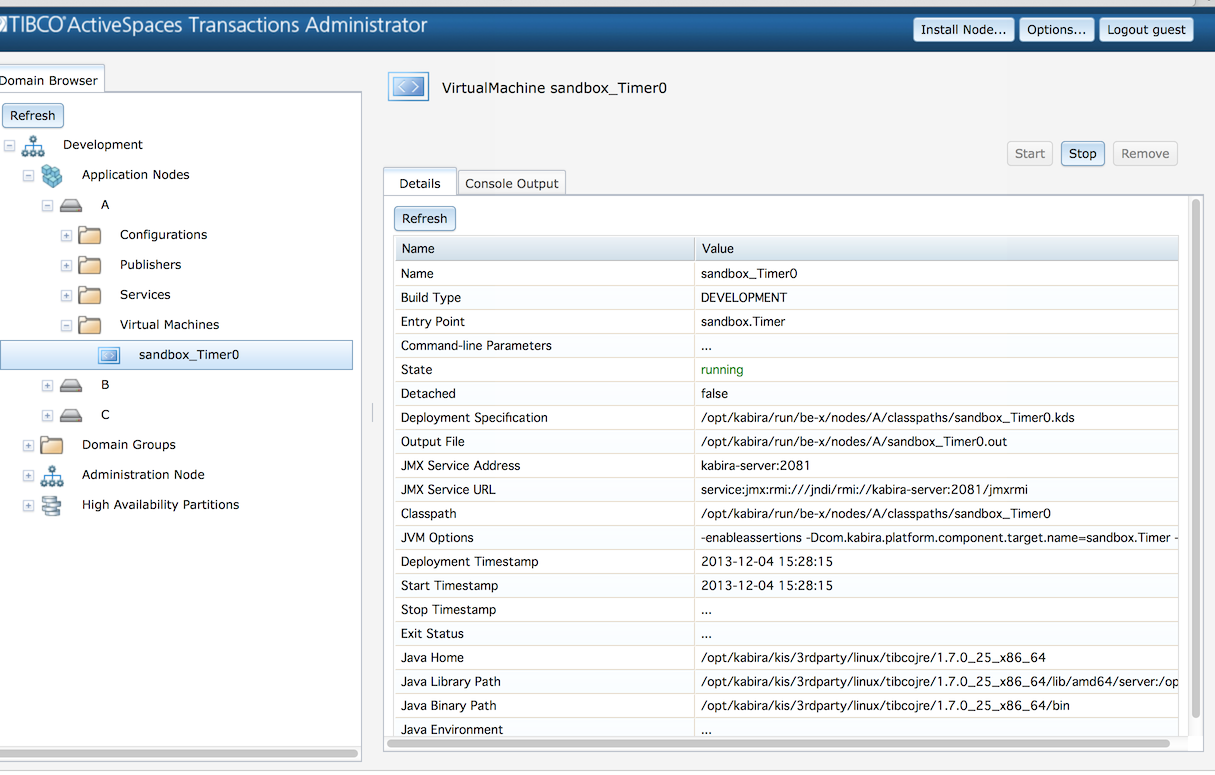
This information is displayed for an engine:
Name - Engine name.
State - Current state.
Build Type -
DEVELOPMENTorPRODUCTIONbuild.Fragment Type - Fragment type.
Fragment Identifier - Fragment identifier.
Fragment Version - Fragment version.
Target - Engine target, for example a Jar or class name.
Target Parameters - Engine parameters specified at deployment
EventFlow Fragment Client URI - URI to access an EventFlow fragment's client port.
LiveView Fragment Client URI - URI to access a LiveView fragment's client port.
EventFlow Fragment Secure Client URI - URI to access a LiveView fragment's secure client port.
Engine Data Area - Engine data area directory.
JMX State - Current JMX state.
JMX Service Address - Network address to connect with JMX.
JMX Service URL - Network URL to connect with JMX.
Install Timestamp - Time engine was installed.
Start Timestamp - Time engine was last started.
Stop Timestamp - Time engine was last stopped.
Exit Status - Exit status last time engine was stopped.
Shutdown Timeout Seconds - Number of seconds engine waits for engine to exit during shutdown.
Java Home - Java JDK/JRE path.
Debugger Port - Debugger port if enabled.
Suspend Type - Type of engine suspend if engine was suspended for debugging. Valid values are
All,JVM,Fragment, orNone.
Once an engine is deployed it can be started, suspended, and stopped. These actions can also be performed from the command line:
//
//  Start an engine
//
epadmin --servicename=A.X start engine --name=sandbox_Timer0

//
//  Suspend an engine
//
epadmin --servicename=A.X suspend engine --name=sandbox_Timer0

//
//  Stop a running engine
//
epadmin --servicename=A.X stop engine --name=sandbox_Timer0