Node logging uses the industry standard Logback logging infrastructure. Log
files are created in a logs directory in the
node directory (see the section called “Application installation” for details). By default the
logs directory contains these log files:
a separate log file for each engine named
<engine-name>.log.an audit log named
audit.log.a transaction deadlock log named
deadlock.log.
See the section called “Default logging configuration” for complete details on the default logging configuration.
There is also a bootstrap directory in the
logs directory. The bootstrap
directory contains internal runtime log files that are used by product
engineering to diagnose support cases. These log files are only
interesting to the product development team.
The log message severities are summarized in Table 2.3, “Log message severities”. These are the standard Logback severities.
Table 2.3. Log message severities
| Severity | Description |
|---|---|
ERROR | A node level error caused by a resource problem (memory, disk, file descriptors, etc.), a corrupted product installation with missing required resources, or host machine failures. The node is terminated and must be reinstalled to restore service. |
WARN | An operational error that impacts a specific operation, application performance or availability of certain services. An operational error is caused by invalid parameters, temporary resource unavailability, or authentication and/or authorization failures. No other node services are affected. The node may automatically recover from this error, but in some cases operator intervention is required for full recovery. |
INFO | A normal status message for node and engine life cycle, resource start-up information, and environment details, for example library version numbers, class path contents, or location of configuration files. No action required. |
DEBUG | Mid-level diagnostic debug messages. Should only be enabled on production systems at the request of support. These messages are only interesting to the product development team. |
TRACE | Low-level diagnostic trace messages. Should only be enabled on production systems at the request of support. These messages are only interesting to the product development team. |
Docker container logging is enabled by configuring a console appender in an application. For example:
<xml version="1.0" encoding="UTF-8"?>
<configuration>
    <appender name="Console" class="ch.qos.logback.core.ConsoleAppender">
        <encoder>
            <pattern>%d{HH:mm:ss.SSS} %10.10thread %-5level %20.20logger{5} : %msg%n</pattern>
        </encoder>
    </appender>
    <root level="INFO">
        <appender-ref ref="Console" />
    </root>
</configuration>
When the container containing the application is started it must
have a pseudo-tty allocated for the console appender to work correctly.
This is done using the tty parameter to the
run command:
docker run --tty --detach --name A.sb10 --network demo-network sb10-demo-application A.sb10
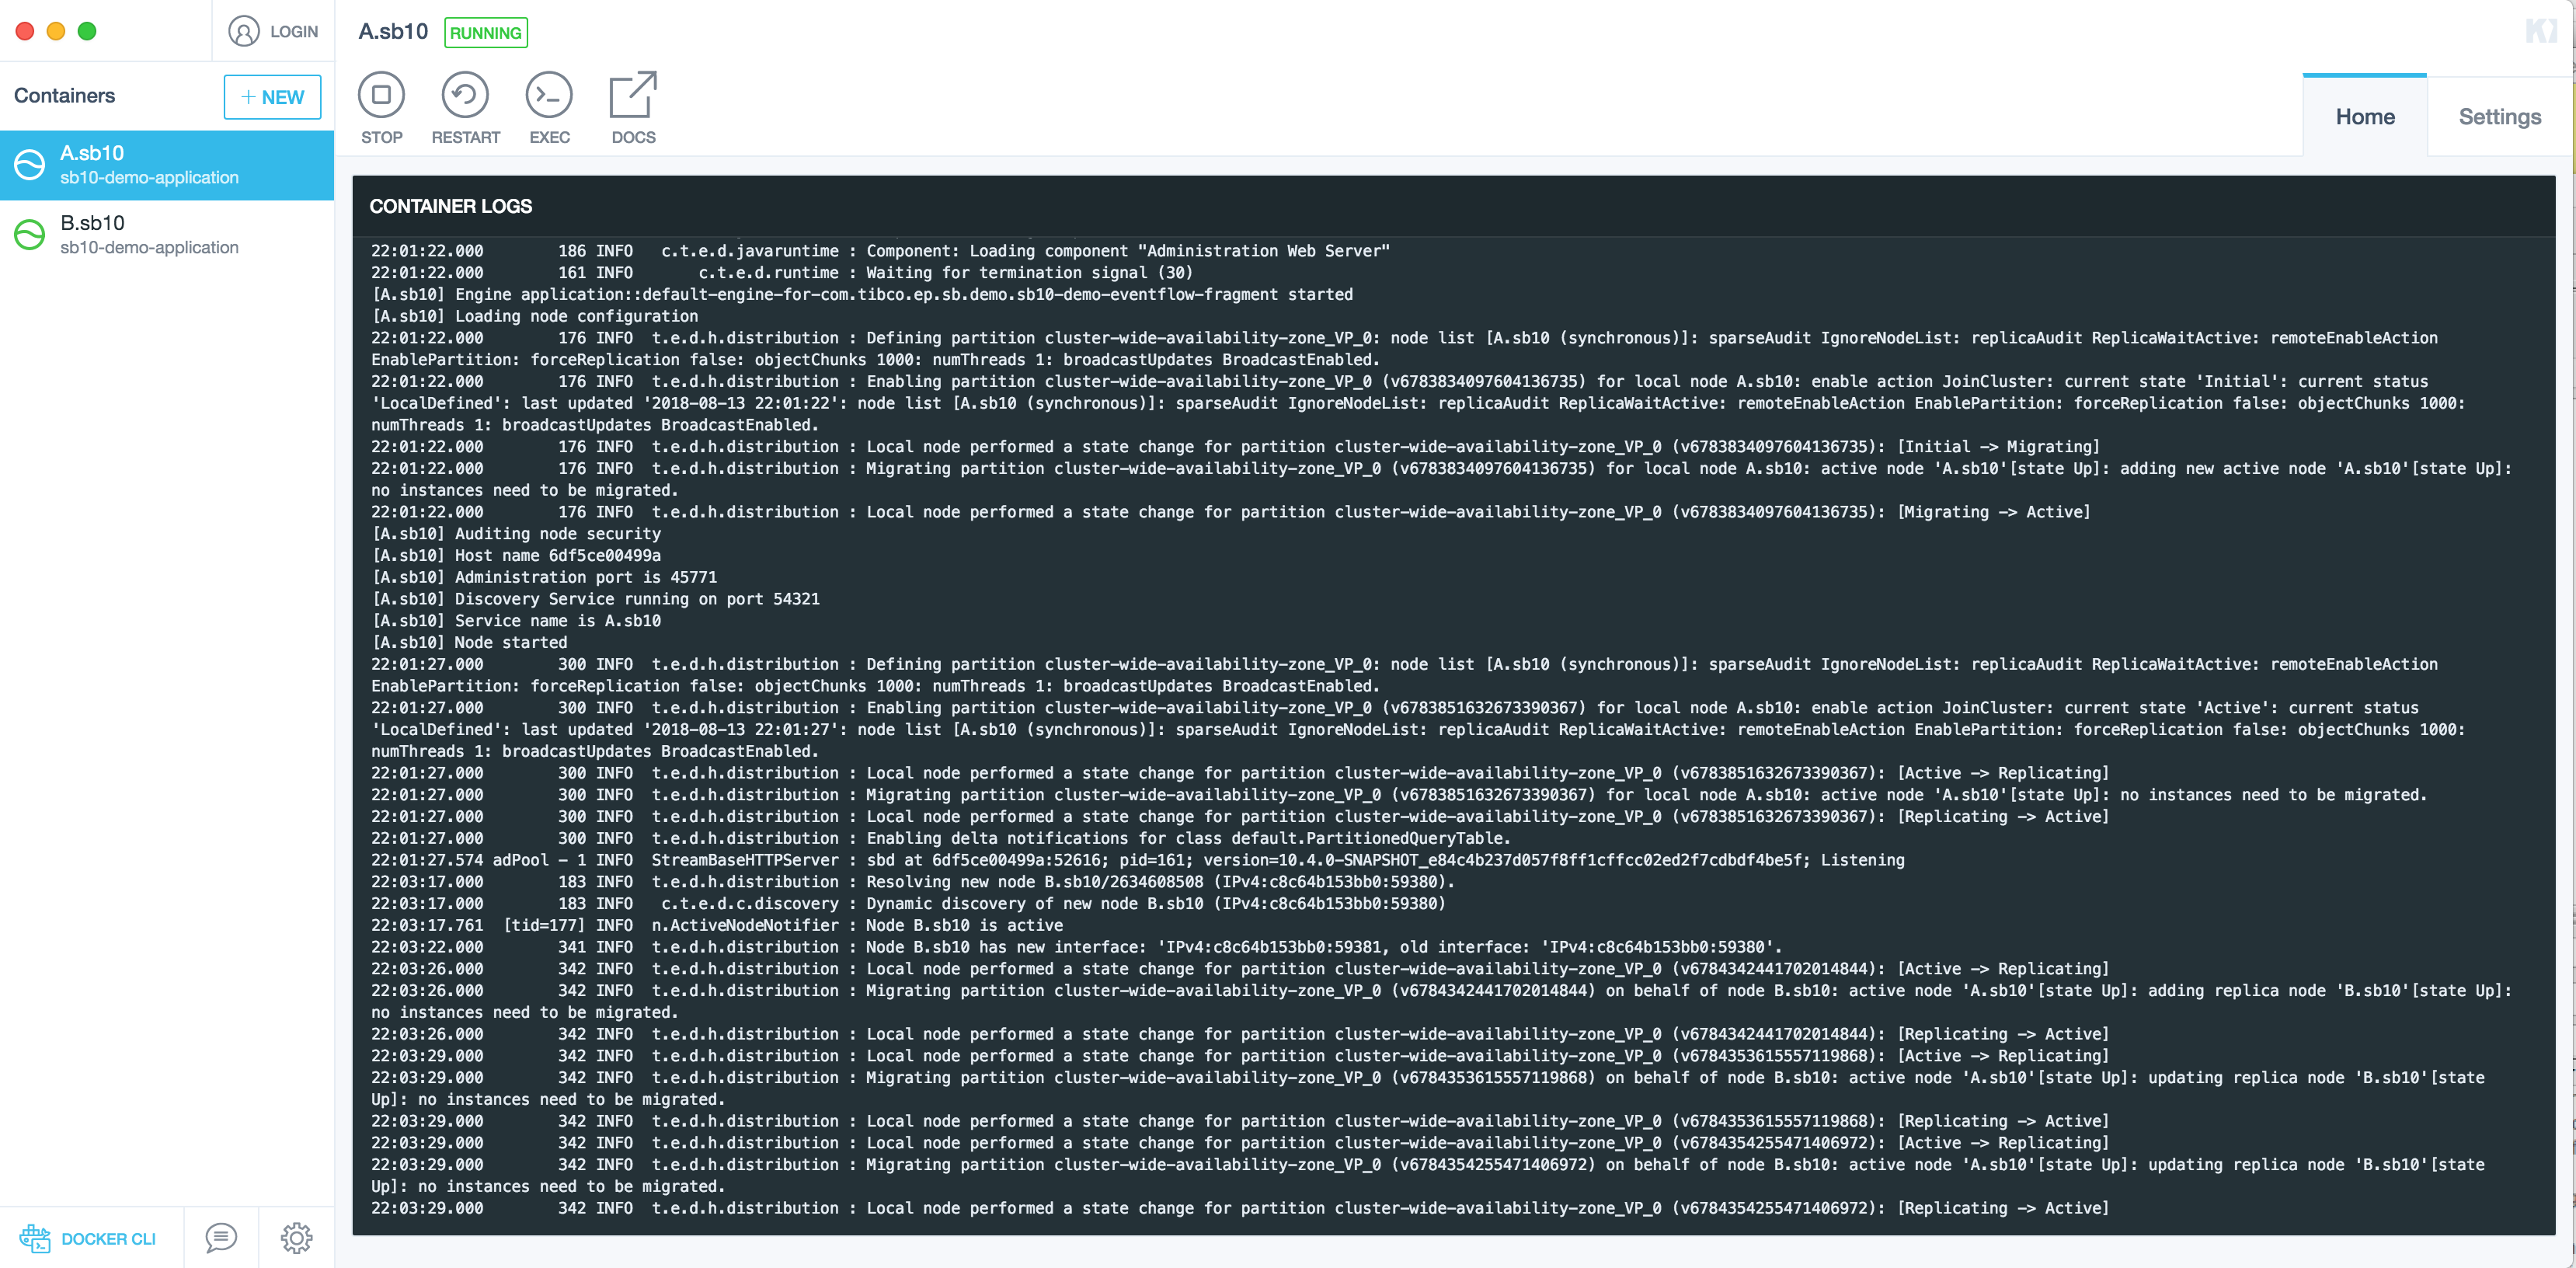
When the container is started all engine logging will be sent to the container logs as shown in Figure 2.11, “Docker container logging”.
Container logging is also available from the docker command line
using the logs command:
docker logs --follow A.sb10
Log configuration uses standard Logback XML or Groovy configuration files with a few extensions. See the Logback configuration documentation for details on the standard configuration values.
The supported extensions are:
%processformat in log appenderpatternconfiguration - the current process identifier.%transactionformat in log appenderpatternconfiguration - the current transaction identifier ornoneif no active transaction, orunavailableif there is an active transaction, but the identifier is not available.%usecformat in log appenderpatternconfiguration - the microsecond offset in the current second.com.tibco.ep.dtm.logging.logDirectoryLogback configuration file substitution variable - the log directory. The default value is<node-directory>/logs. This can be overridden in Logback configuration files.com.tibco.ep.dtm.logging.logFileNamePrefix
While it is possible to move the location of the engine log files
outside of the
<node-directory>/logs
directory using configuration, if this is done, engine log messages are
sent to both the configured location of the engine log file and also the
default engine log in the logs directory. This is
done to ensure that snapshot files include all logging from the node for
diagnostic purposes. If an engine log file is configured to not use the
default engine log file name, but the log file is left in the
logs directory, only the configured log file name is
used.
This example shows the use of these extensions in a Logback XML configuration file.
<?xml version="1.0" encoding="UTF-8"?>
<configuration>
  <appender name="FILE" class="ch.qos.logback.core.FileAppender">
    <file>${com.tibco.ep.dtm.logging.logDirectory}/${com.tibco.ep.dtm.logging.logFileNamePrefix}.log</file>
    <encoder>
      <pattern>d{HH:mm:ss.SSS} %usec %process %thread %transaction %-5level %logger: %msg%n</pattern>
    </encoder>
  </appender>
  <root level="INFO">
    <appender-ref ref="FILE"/>
  </root>
</configuration>
Logging configuration is processed in this order:
Default logging configuration (see the section called “Default logging configuration”)
Logging configuration contained in fragment archives.
Logging configuration contained in an application archive.
The Logback configuration file resolution rules use the standard
LogBack conventions described here.
The logging configuration can also be changed at runtime using the
logging administration target. See the section called “Administration”.
Details on packaging logging configuration into fragment and application archives is in the Transactional Memory Developers Guide.
The runtime logging level can be changed using the
logging administration target. There is support for
both getting and setting the current log level for all loggers running
in each engine in a node.
![[Note]](images/note.png) | |
The |
To set the log level for a logger, the logger name must be known.
The loggers that are displayed using the display
logging command were:
explicitly configured as described in the section called “Configuration”.
or previously set using the
set loggingcommand.
For example:
//
//    Get loggers and logging level for the Pattern_sbapp0 engine
//
epadmin --servicename=A.X display logging --enginename=Pattern_sbapp0
Engine Name = Pattern_sbapp0
Logger Name = ROOT
Log Level = INFO

Engine Name = Pattern_sbapp0
Logger Name = com.sun.jersey
Log Level = WARN

Engine Name = Pattern_sbapp0
Logger Name = com.tibco.ep.dtm.audit
Log Level = INFO

Engine Name = Pattern_sbapp0
Logger Name = org.apache.shiro
Log Level = DEBUG

//
//    Set the ROOT logging level to DEBUG for all engines
//
epadmin --servicename=A.X set logging --loggername=ROOT --level=DEBUG
Engine Name = Pattern_sbapp0
Logger Name = ROOT
Previous Log Level = INFO
New Log Level = DEBUG

Engine Name = System::administration
Logger Name = ROOT
Previous Log Level = INFO
New Log Level = DEBUG

//
//    Load a new log configuration file on all engines
//
epadmin --servicename=A.X --set logging --configuration=new-logging-config.xml
Complete details on the logging target can be
found in the section called “logging target”.