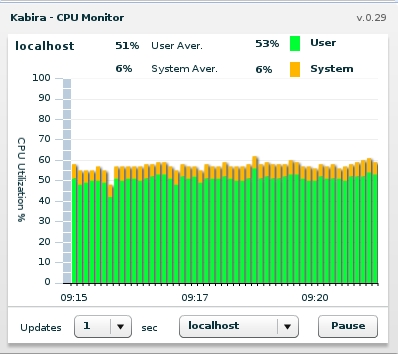
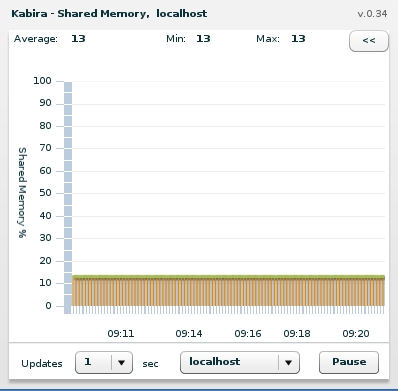
Graphical display of application transaction statistics,
CPU utilization, and shared memory utilization is
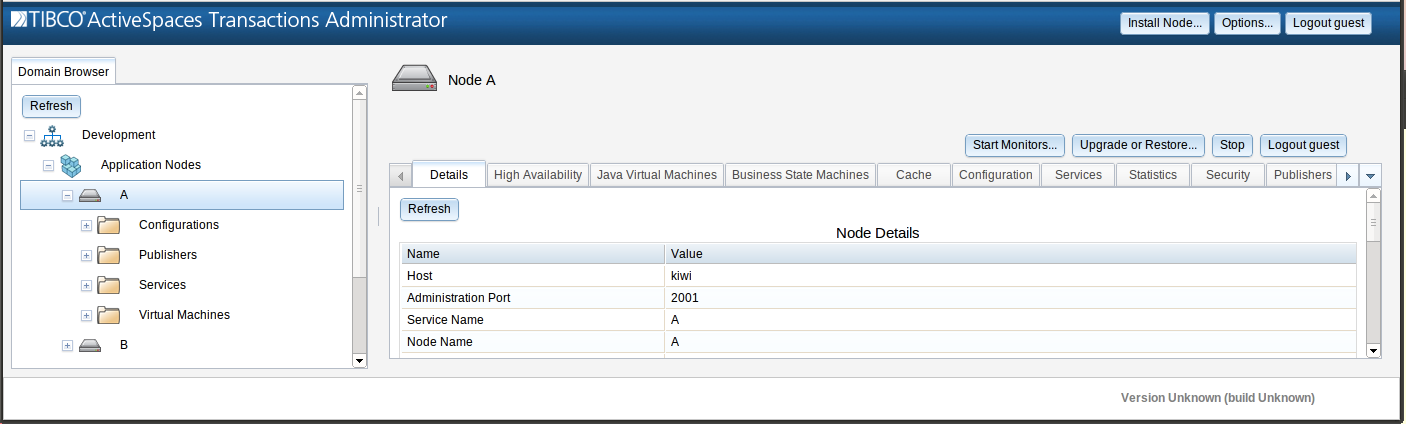
available from the Node panel of TIBCO StreamBase® Runtime
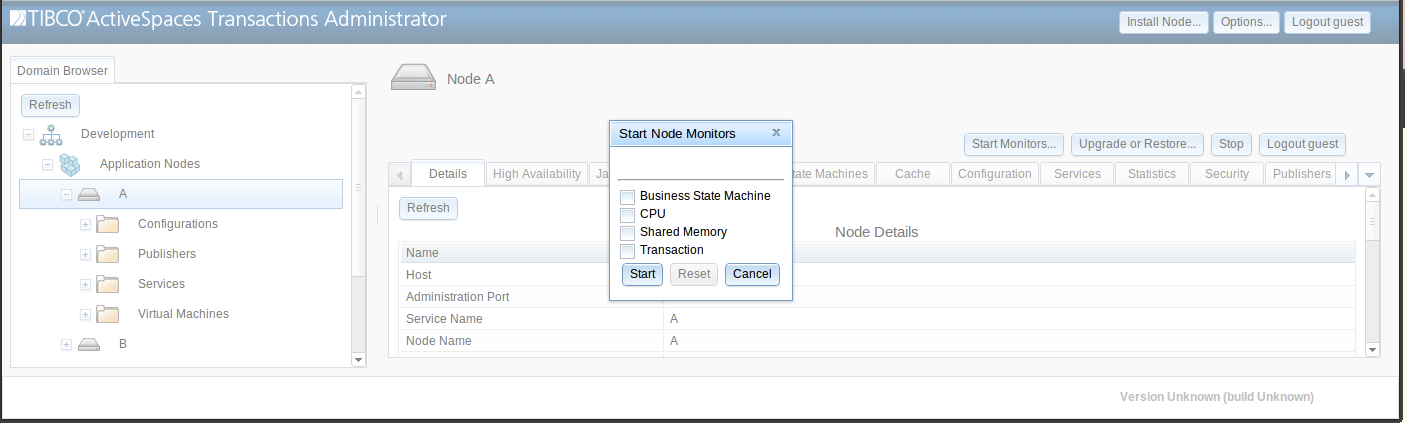
Administrator. Click the
Start monitors button:
This will open window which allows the selection of which graphical monitors to start.
The runtime continually collects a node-wide view of the aggregate transaction rate per second, and the average execution time. The Transaction Monitor in TIBCO StreamBase® Runtime Administrator is used to display both the transaction rate and the average transaction execution time.
The transaction rate is a count of all transactions executing over a period of time.
The transaction execution time is an average of the execution time of all transactions over a period of time. The transaction execution time is the total time from when a transaction is started to when it commits or rolls-back. This time includes all, or a sub-set, of the following depending on the transaction:
application code execution time
transaction lock acquisition and logging time
network latency to remote nodes for distributed transactions
replication latency to remote nodes for highly-available objects
transaction commit or rollback time
The Transaction Monitor has these controls:
Time vs. Rate - Display transaction rate or execution time.
Sample Duration - Set the sample duration in seconds. This controls the interval between querying the server for new data for the display.
Pause or Start - Pause or re-start transaction monitoring.
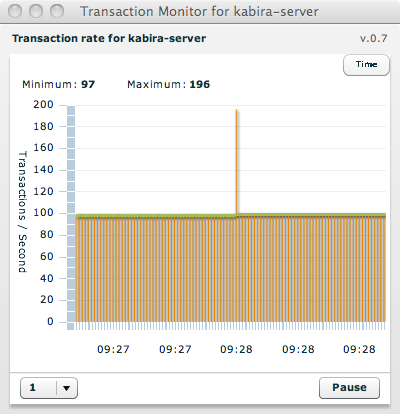
Figure 5.8, “Node transaction rate” shows an example of displaying the node transaction rate.
When the Transaction Monitor is started on a cluster, the results show the cluster-wide aggregate application transaction rate. Figure 5.9, “Cluster-wide transaction rate” shows an example of displaying the cluster-wide transaction rate.
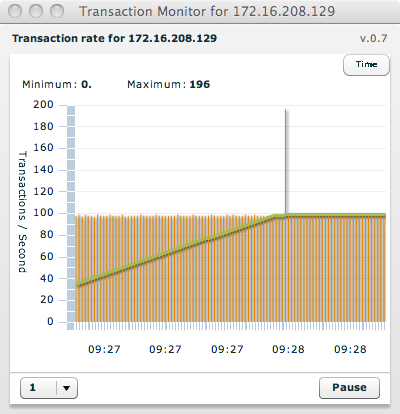
The Transaction Monitor displays the following information when displaying transaction rates:
Network address- the address of the node being monitored.Minimum- the minimum transaction rate since the monitor was started.Maximum- the maximum transaction rate since the monitor was started.Transactions / Second- a graphical display of the number of transactions per second plotted against time.
Selecting Time using the Time vs. Rate
button on the Transaction Monitor displays the execution time for
transactions on a single node or aggregated for all nodes in a cluster.
Figure 5.10, “Node transaction execution time” shows an example
of transaction execution time for a node and Figure 5.11, “Cluster-wide transaction execution time” shows the same
thing for a cluster.
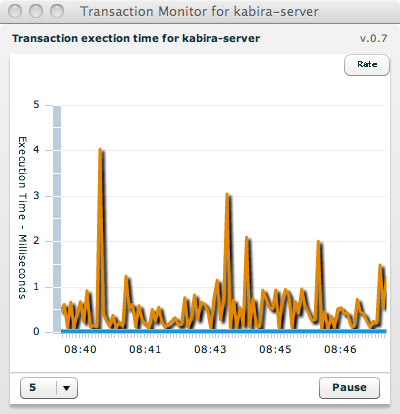
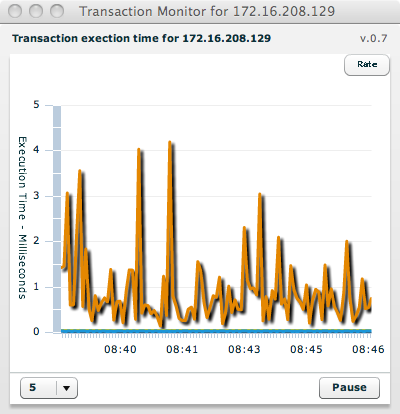
The Transaction Monitor displays the following information when displaying transaction execution time:
Network address- the address of the node being monitored.Execution Time- a graphical display of the minimum, maximum, and average execution time in milliseconds plotted against time. The different values are viewed by selecting the monitor and hovering a mouse pointer over the plot.